Monitoring
Monitoring helps you inspect database activity and operational issues, especially for ClickHouse connections.
Entry Points
Monitoring is available from supported connections when the connected user has permission to read the required system tables or operational metadata.
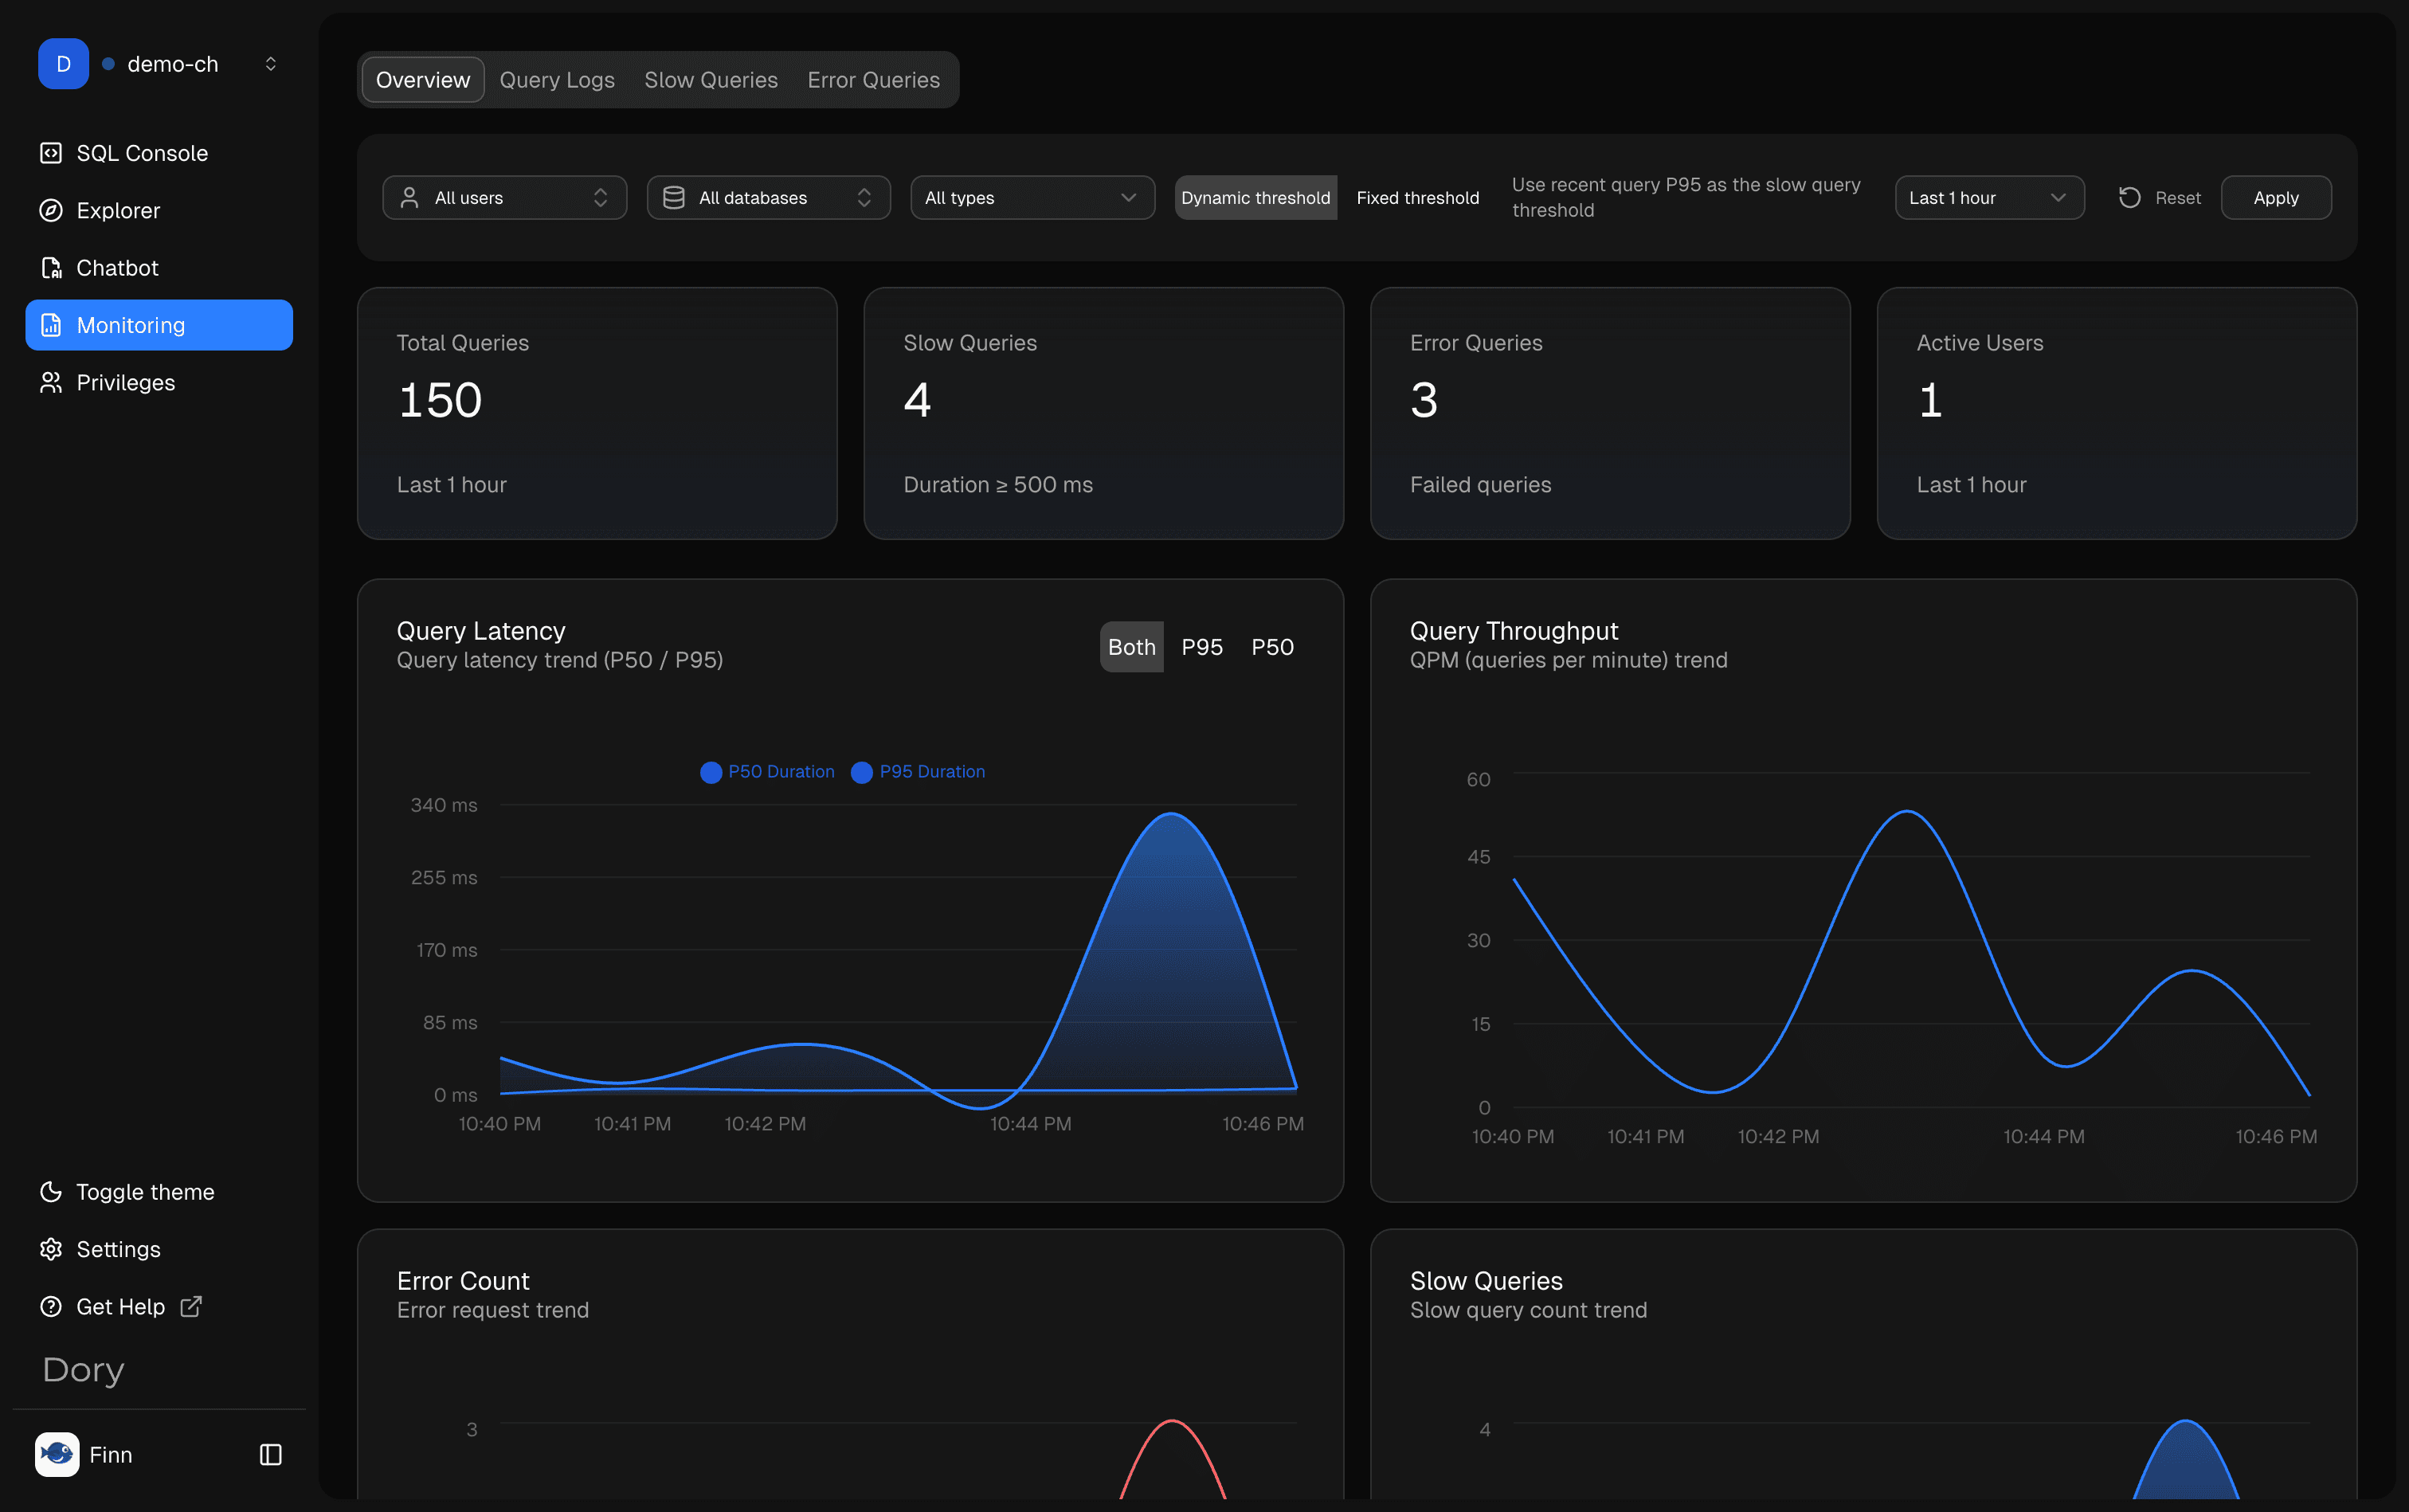
Overview
Use Overview to understand recent activity, workload shape, and whether the database has visible operational signals worth investigating.
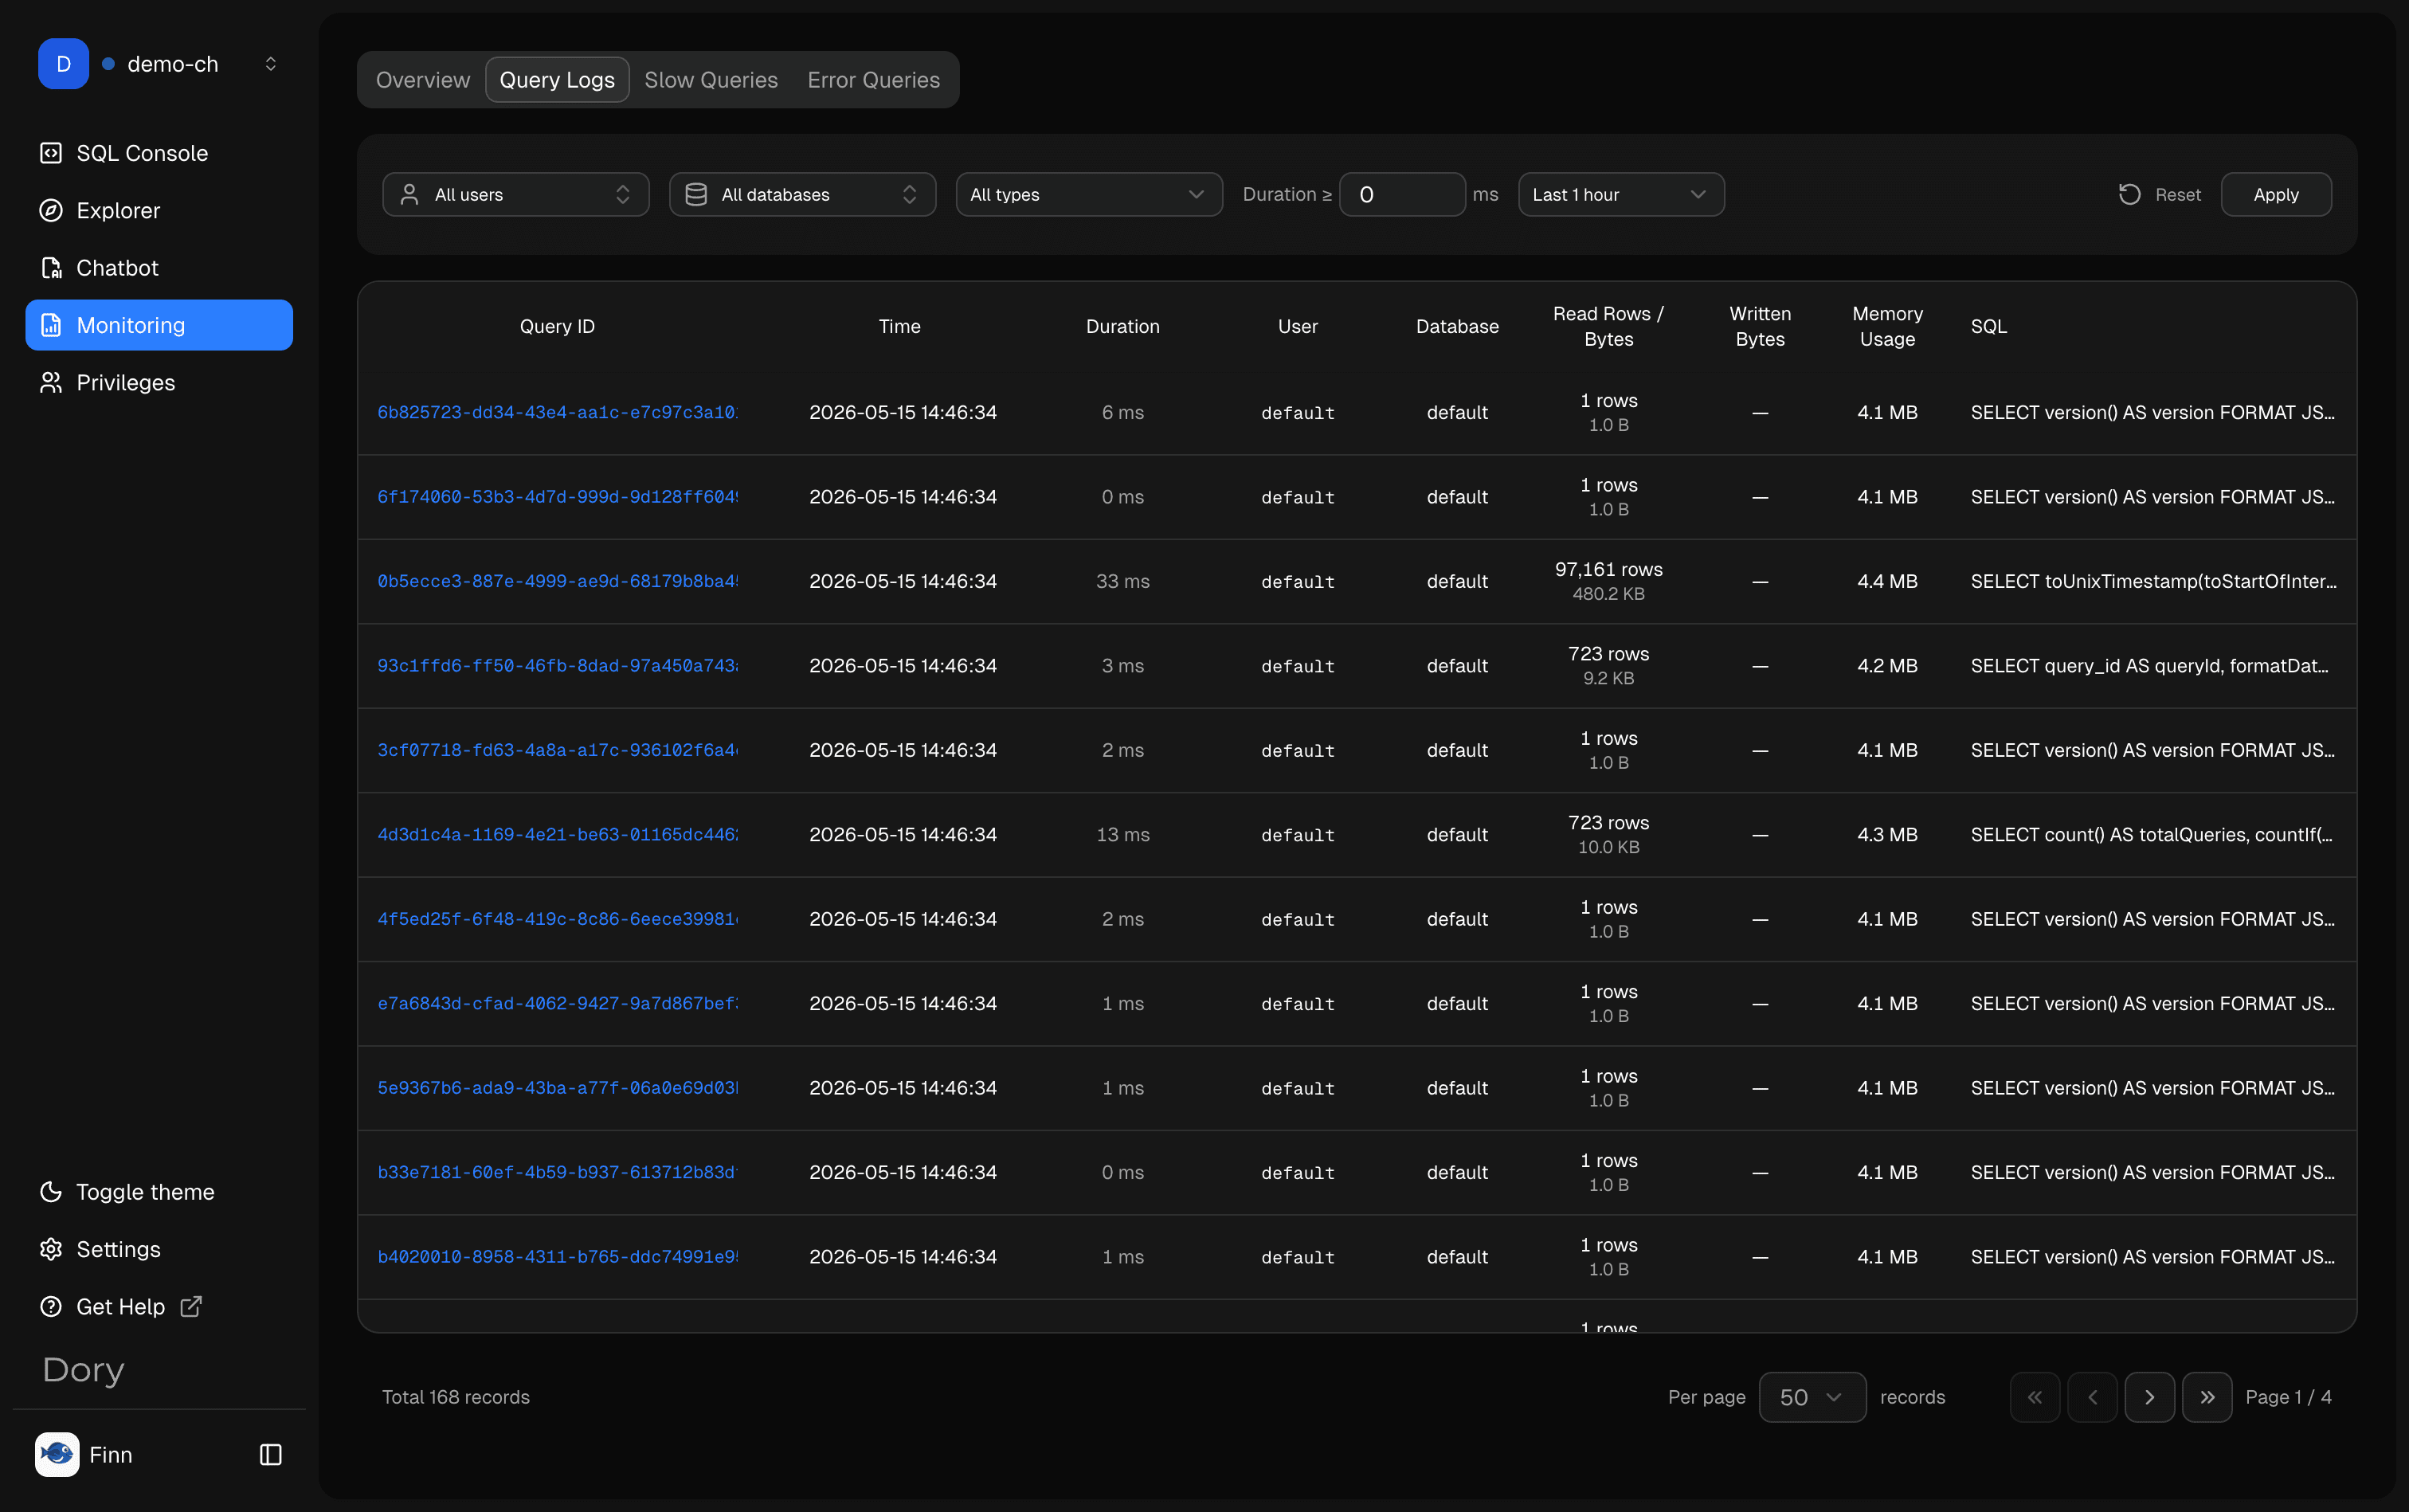
Query Logs
Query Logs show recent SQL activity. Use them to understand who ran what, when it ran, and how it behaved.
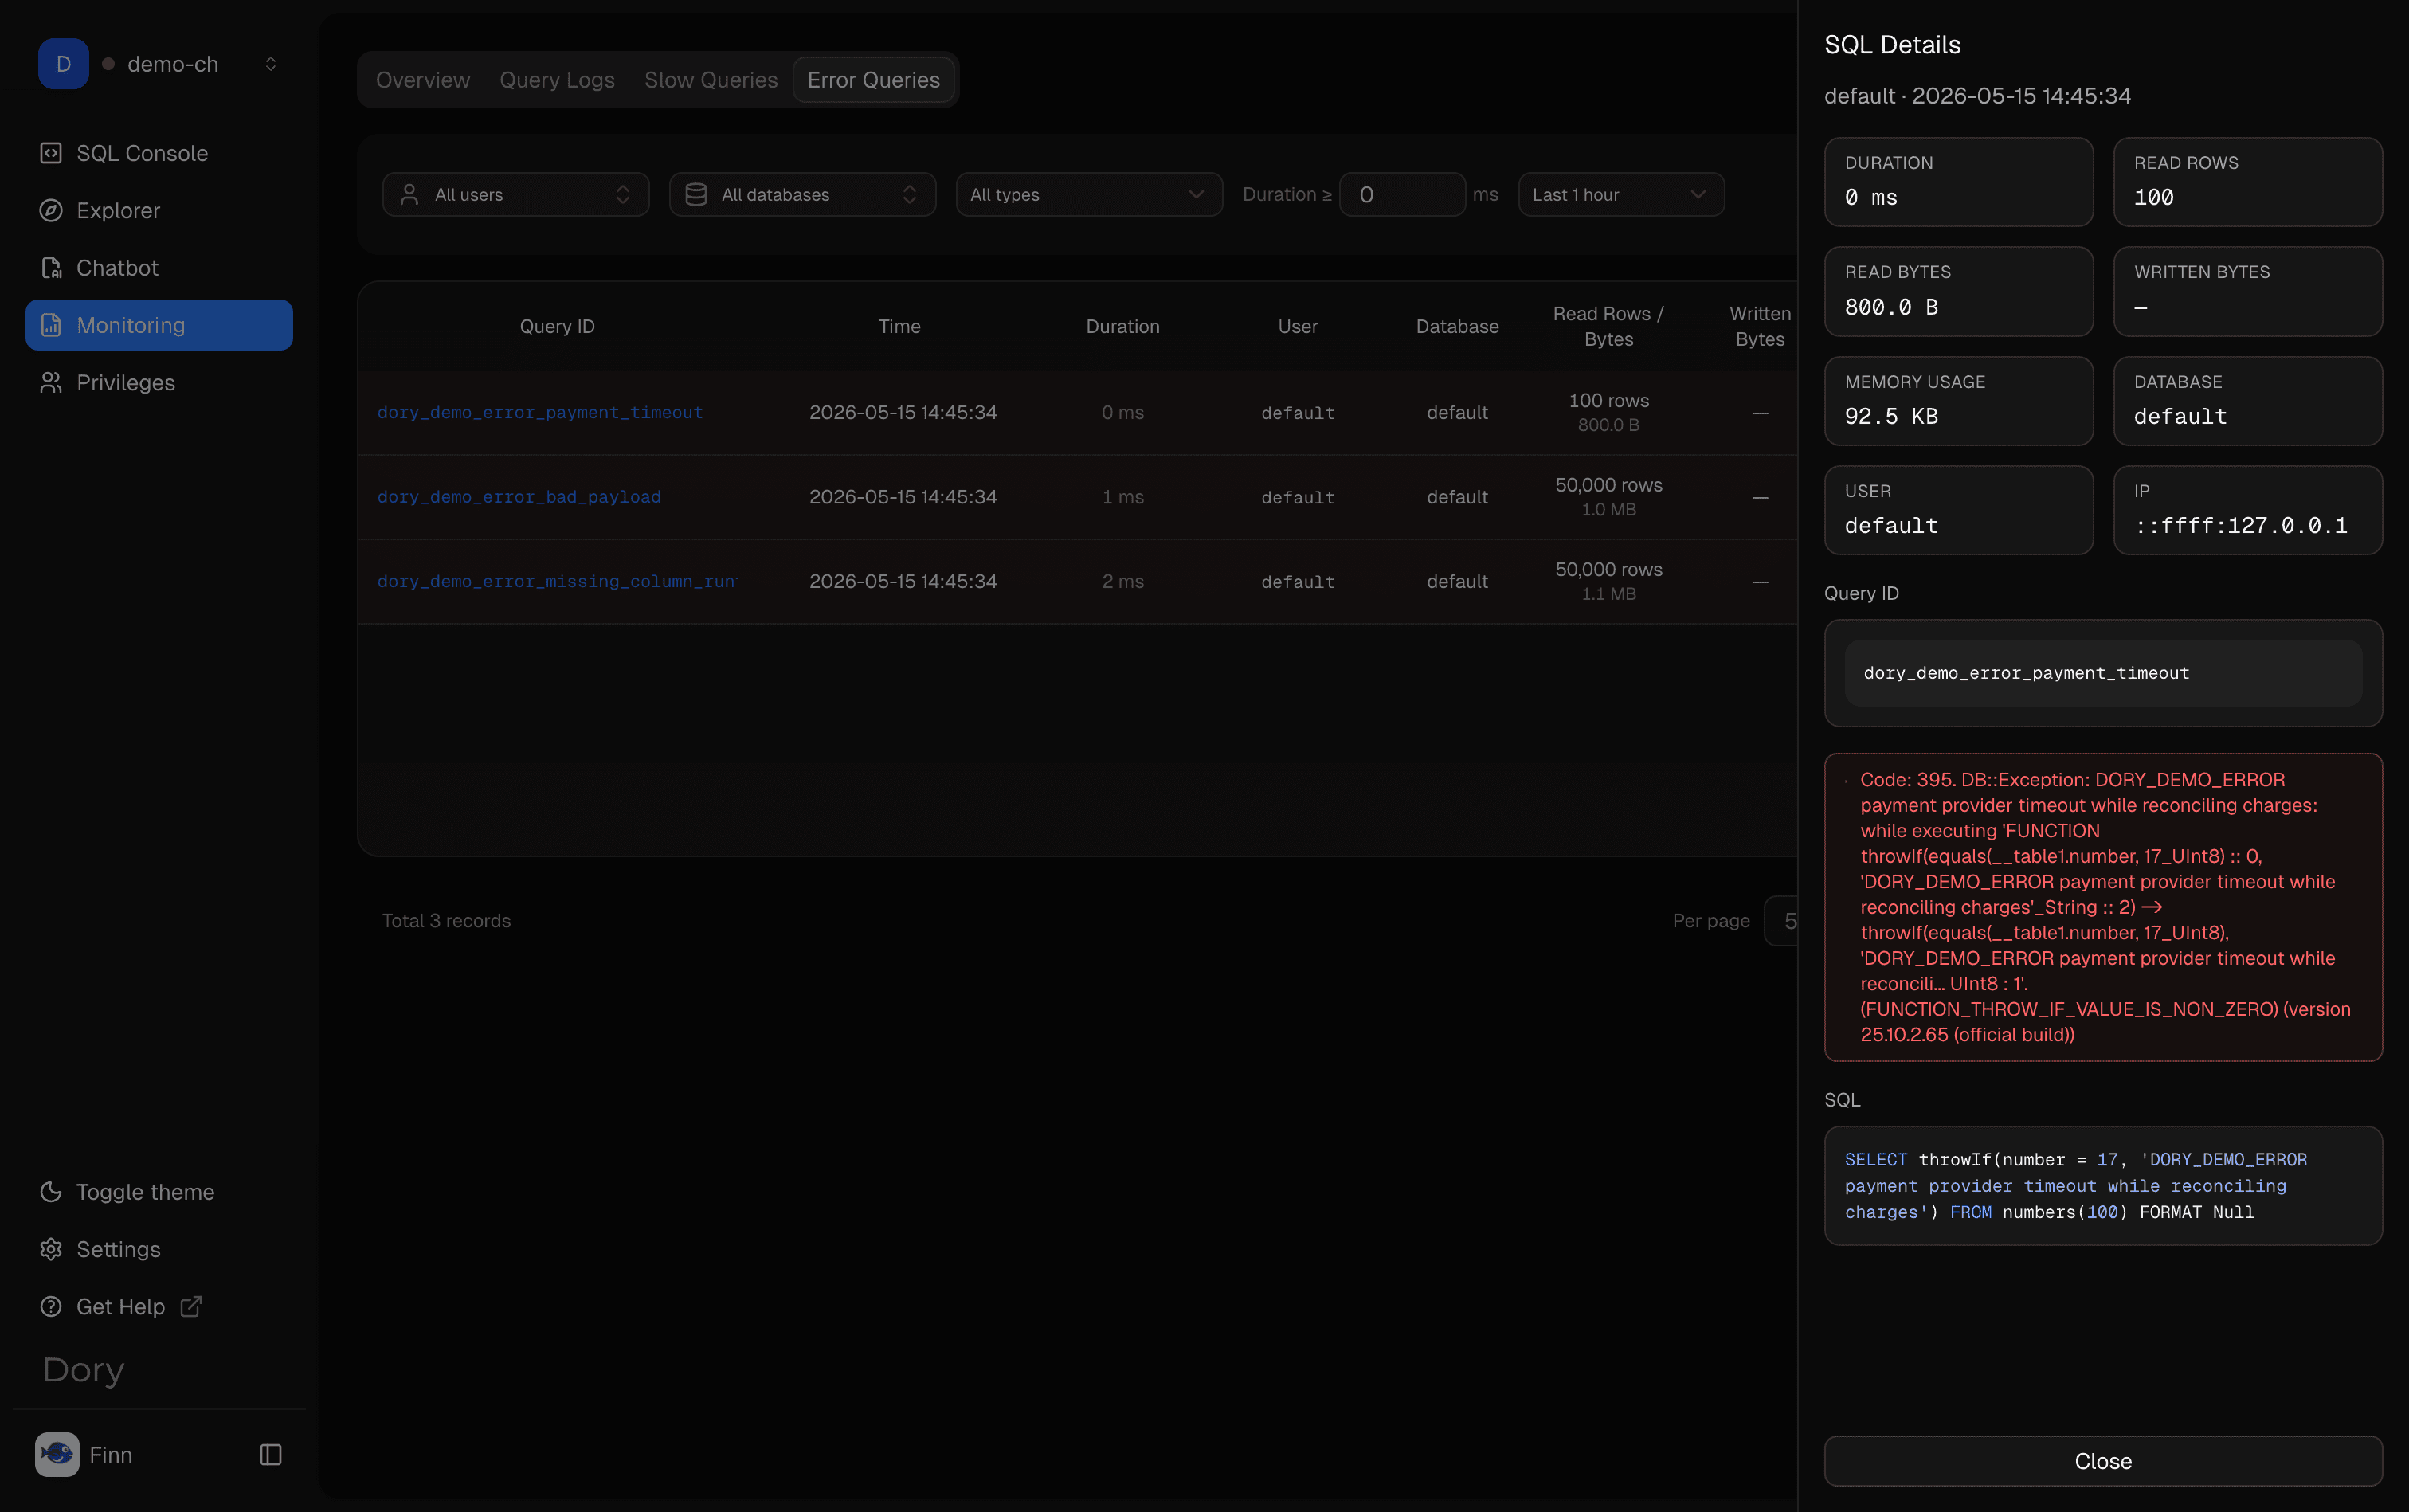
Click a Query ID in Query Logs, Slow Queries, or Error Queries to open the SQL Details panel. The detail view shows execution metadata, read volume, memory usage, error text when available, and the full SQL.
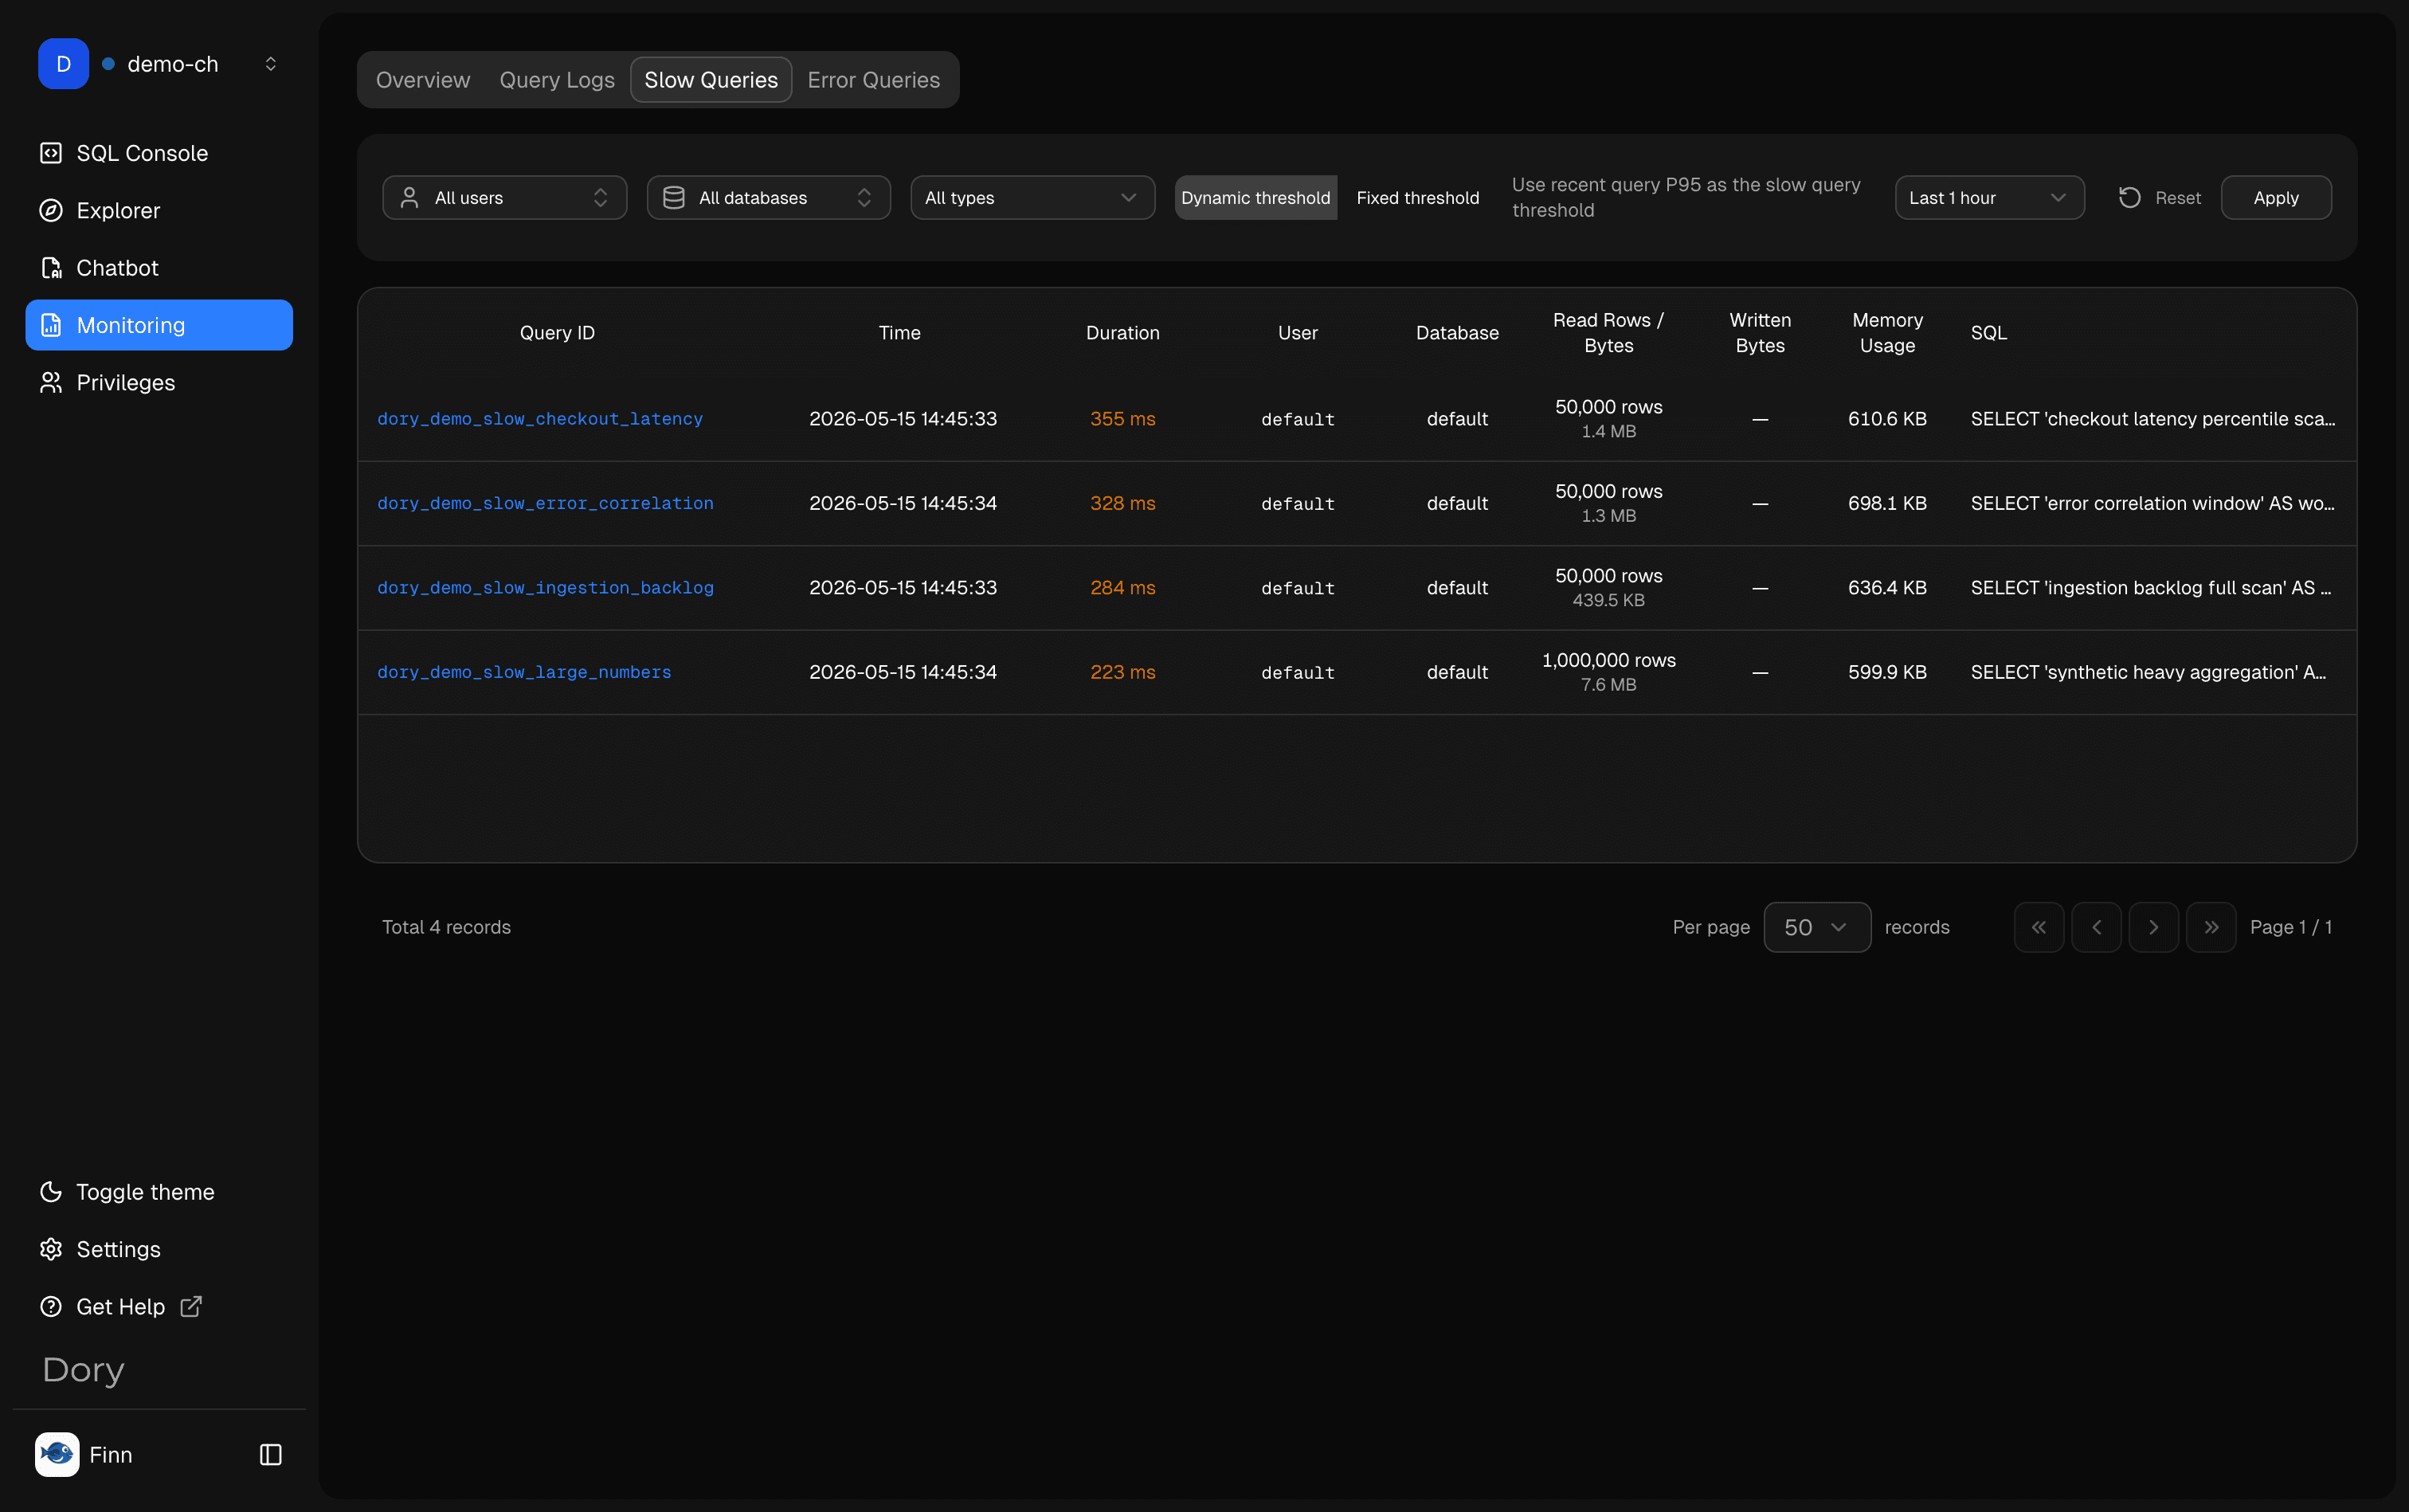
Slow Queries
Slow Queries help you identify expensive SQL that may need filtering, aggregation changes, partition pruning, or schema-level optimization.
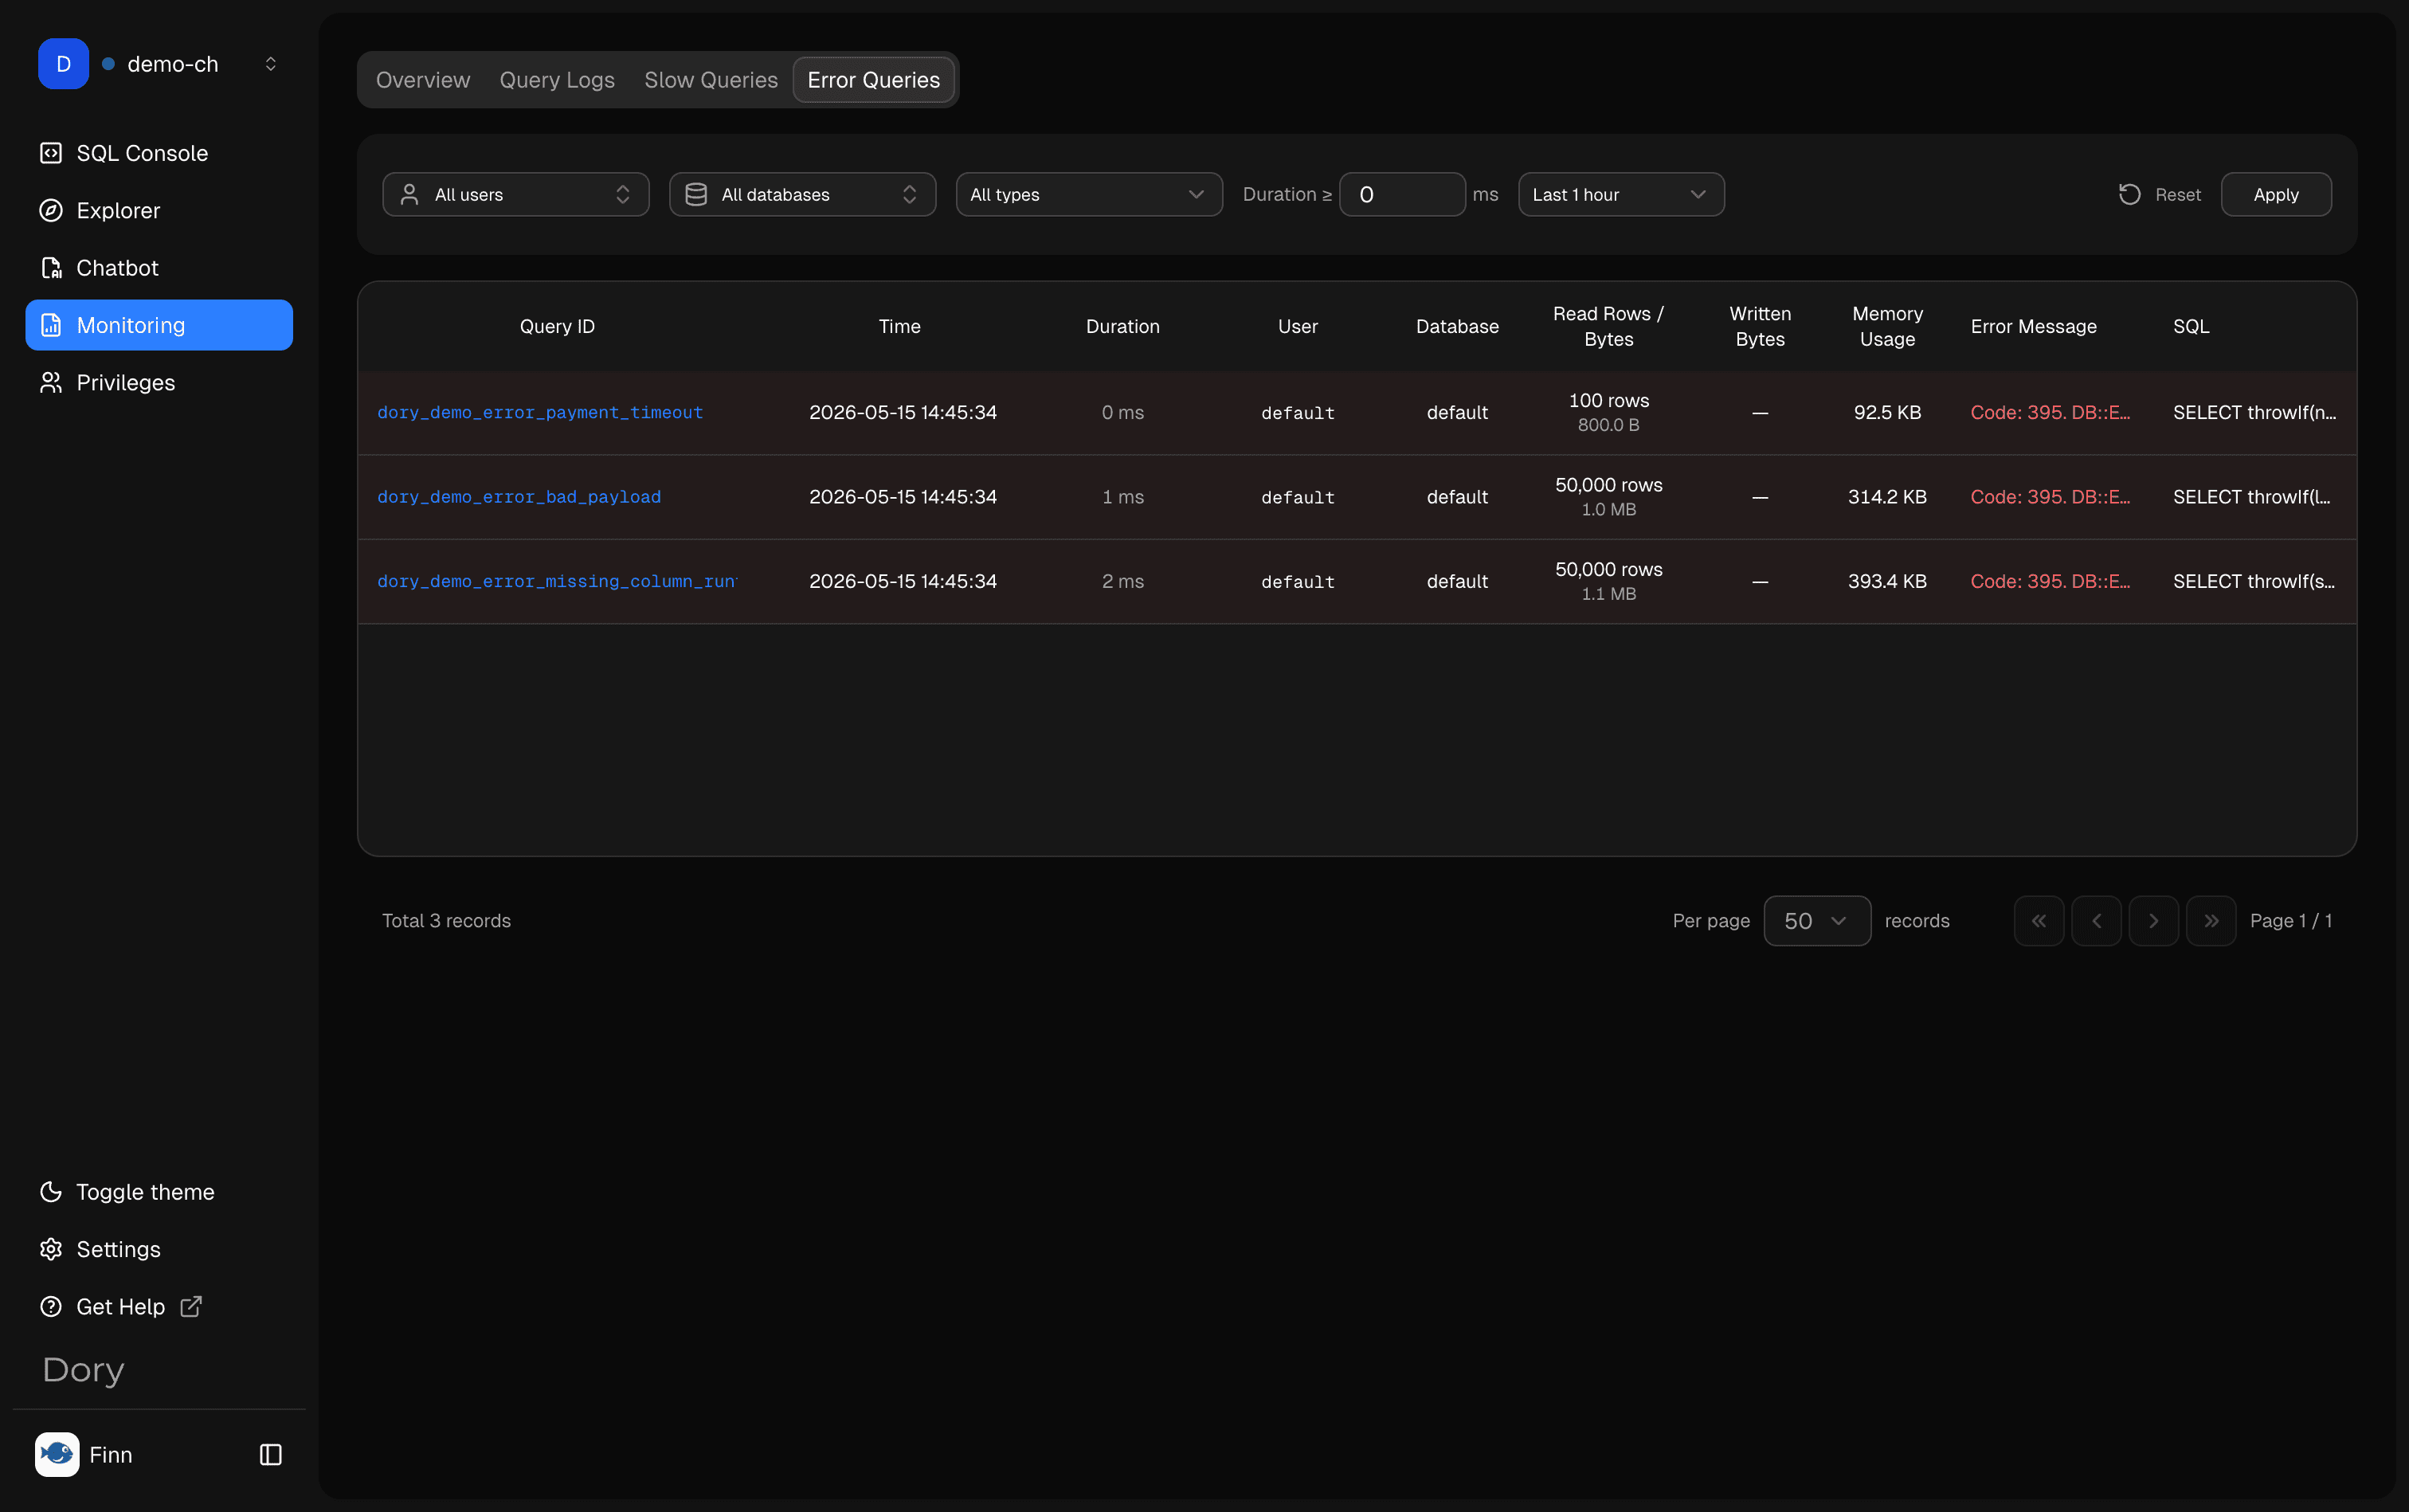
Error Queries
Error Queries help you find recurring failures, syntax problems, missing columns, permission issues, or runtime errors.
Usage Recommendations
- Start from Overview before drilling into details.
- Use time ranges to narrow investigation.
- Compare slow queries with similar successful queries.
- Ask AI to explain a slow or failing query, but verify any suggested rewrite.
- Use read-only operational accounts where possible.
Related Pages
How is this guide?